Description
The Global panel shown below is split into four frames: Geometry Characteristics, Resolution, Goals,
and Display. This panel condenses the basic tools you need to do the following:
- Visualize the geometric characteristics of the selected database models
- Define the meshing resolution and quality goals
- Visualize the size
field that drives the creation of the unstructured domains
- Visualize the most relevant mesh quality metrics of the created unstructured domains
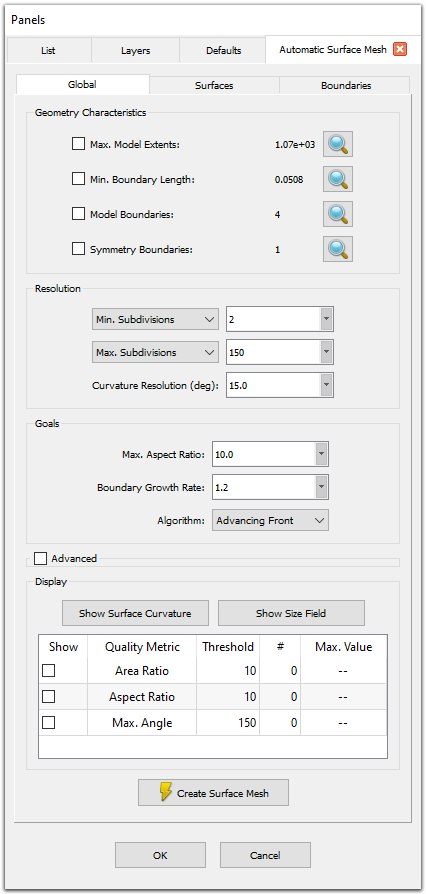
The Global panel presents the basic tools needed to inspect the geometric characteristics of the selected database models, to define the meshing resolution
and quality goals, and to visualize the size field and the most relevant mesh quality metrics.
Geometric Characteristics
The tools contained in this frame are designed to visualize the geometric characteristics of the selected database models to be meshed. Furthermore, these
tools allow you to not only review the numeric values of such characteristics but also to render them and to zoom in or out to clearly visualize
them.
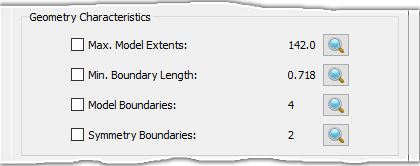
The Geometric Characteristics frame displays geometric information related to the database model to be meshed. Furthermore, the tools in this frame allow you
to control what information is displayed and also zoom in to the precise areas of interest.
The following geometric characteristics parameters are presented in this frame:
- Max. Model Extents: This parameter reports the maximum extents of the selected database models. If the corresponding check box is checked
on, a white box encompassing all of the models and aligned with the principal planes is rendered in the Display window in wireframe style. This box
represents the extents of the selected database models.
- Min. Boundary Length: This parameter reports the minimum boundary length in the selected database models. If the corresponding check box
is checked on, the corresponding edge is rendered in white in the Display window.
- Model Boundaries: This parameter reports the number of lamina boundaries in the selected database models. Lamina boundaries correspond to
surface edges used by exactly one database surface. If the corresponding check box is checked
on, the lamina boundaries are rendered in red in
the Display window. For more information on lamina boundaries, please review the Models section in this User
Manual.
- Symmetry Boundaries: This parameter reports the number of symmetry boundaries in the selected database models. Symmetry boundaries are
lamina boundaries that form a closed loop and are contained on one of the principal planes within a symmetry tolerance. If the corresponding check box is
checked on, these boundaries are rendered in green in the Display window.
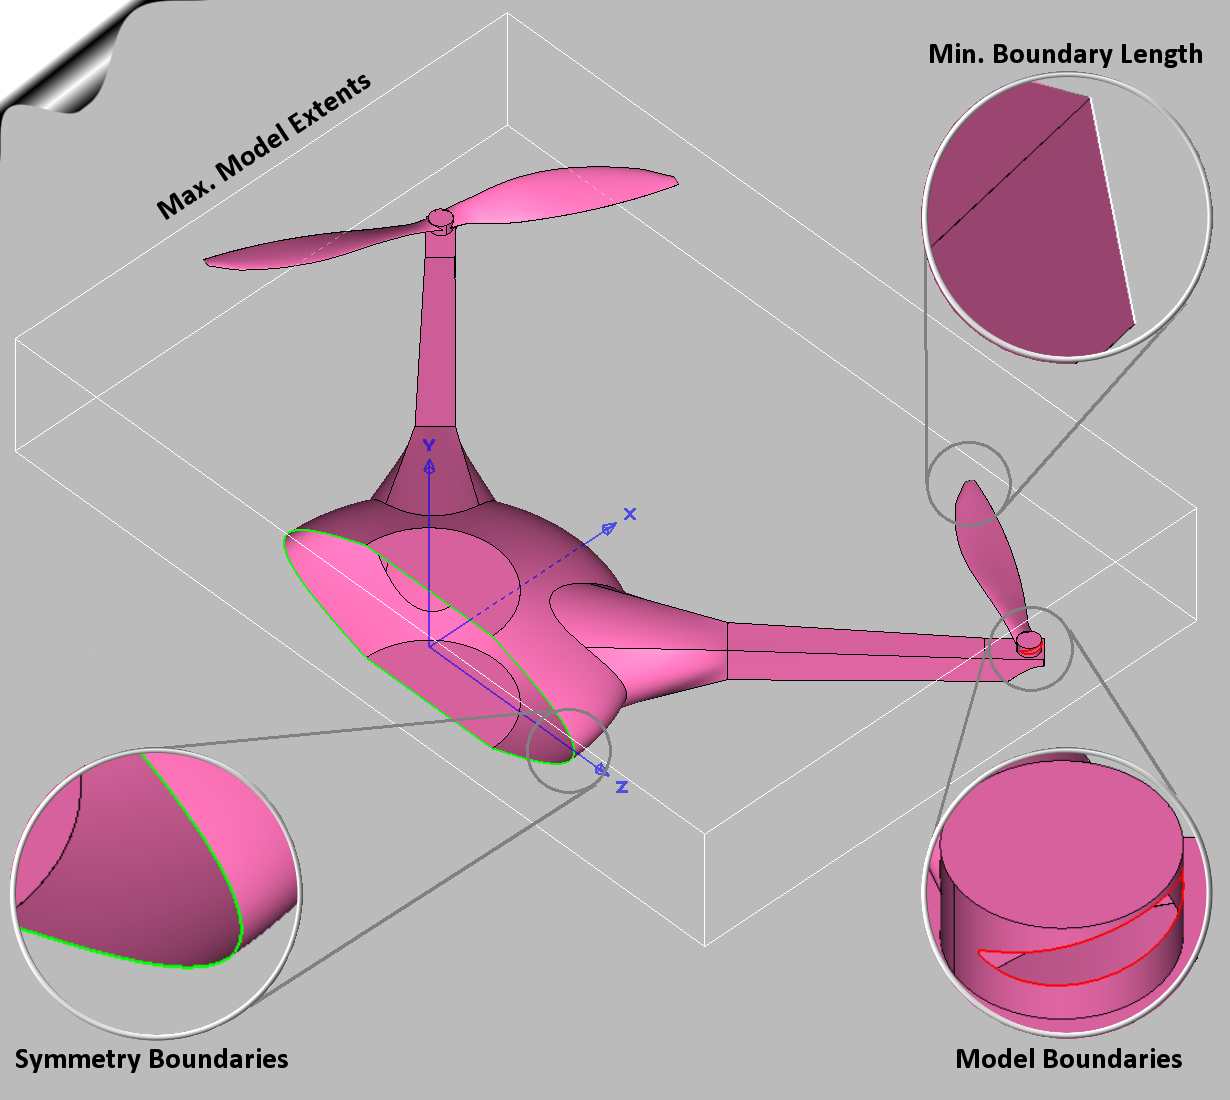
The geometric characteristics of the database models to be meshed are color coded when rendered in the Display window for easy visualization.
Note: It is important to note that the extent box displayed by the Max. Model Extents command is always aligned with the
primary planes. Likewise, the Symmetry Boundaries command can only detect symmetry boundaries that are aligned with one of the primary planes.
A few additional tools common to all the geometric characteristics parameters detailed above are designed to aid in their visualization. The magnifying lens
( ) enables you to zoom in or out to clearly visualize the appropriate characteristic. Additionally, hovering your mouse over the label
with the name of a parameter displays a tool tip with pertinent information. Last but not
least, hovering your mouse over the label with the value of a
parameter renders the parameter (as discussed above) in the Display window and zooms in or out for clear visualization.
) enables you to zoom in or out to clearly visualize the appropriate characteristic. Additionally, hovering your mouse over the label
with the name of a parameter displays a tool tip with pertinent information. Last but not
least, hovering your mouse over the label with the value of a
parameter renders the parameter (as discussed above) in the Display window and zooms in or out for clear visualization.
Hovering your mouse over the label with the name of one of the geometric characteristic
parameters displays a tooltip with pertinent information.
Resolution
The tools contained in this frame allow you to adjust the resolution of the connectors to be created based on the characteristics of the underlying database geometry.
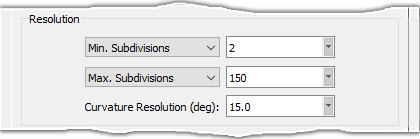
The Resolution frame provides tools to adjust the mesh resolution goals (i.e. target edge length) based on the characteristics of the underlying database
surfaces.
The first pull down list in this frame contains two options to define the minimum number of grid
points for features in the geometry and is used to seed the surface mesh generation process. It
is important to keep in mind that the term "subdivisions" refers to the number of grid points
minus 1 and "edge length" refers to the distance between two consecutive grid points. Use the entry
field next to the list to specify the numeric value for the selected option:
- Min. Subdivisions: This option is used to explicitly define the minimum
number of subdivisions and is the default option with a default value of 2.
- Min. Edge Length: If this option is selected, the minimum subdivisions is
computed as the minimum boundary length in the selected database models (see
Min. Boundary Length above) divided by the edge length
specified in the entry field.
Note: When changing between the Min. Subdivisions and Min. Edge
Length options (or analogously, between the Max. Subdivisions and Max. Edge
Length options described below), the value shown in the entry field is computed considering the
minimum boundary length (or maximum model extents) of the selected database models and the
value of the previously selected option.
Analogously, the second pull down list in this frame contains two options to define the
initial number of grid points for features in the geometry and is used to seed the surface mesh
generation process. It is important to keep in mind that the term "subdivisions" refers to the
number of grid points minus 1 and "edge length" refers to the distance between two consecutive grid
points. Use the entry field next to the list to specify the numeric value for the selected
option:
- Max. Subdivisions: If this option is selected, the initial edge length for
a feature is computed as the maximum model extents (see
Max. Model Extents above) divided by the number of
subdivisions specified in the entry field. This is the default option with a default value of 150.
- Max. Edge Length: This option is used to explicitly define the initial edge
length for a feature.
Caution: The minimum and maximum subdivisions/edge lengths are used to
define the minimum and initial number of grid points for the features in the geometry and
seed the surface mesh generation process. Characteristics of the underlying geometry,
curvature resolution, goals, and local sizing may cause additional refinement.
The last parameter in this frame, Curvature Resolution (deg), is used by the Automatic Surface Mesh functionality in two ways: to define
the maximum angular deviation that drives the resolution of new connectors and to define the maximum turning angle associated with
the Angle boundary condition
type used by the 2D T-Rex algorithm. This parameter
has a default value of 15.0 and it is expressed in degrees. Use the appropriate entry field to specify its numeric value.
For more information on how the maximum angular deviation effectively drives the resolution of connectors and unstructured domains, please review the
definition of the Max. Angle parameter in the Curvature
and Cells sections respectively.
Additionally, in order to understand the involvement of
the T-Rex algorithm and its boundary conditions in the
automatic creation of unstructured domains, it is important to note that the Automatic Surface Mesh functionality initially attempts to classify all
the edges in the selected database models as one of three types: Curvature, Convex, and Concave. The connectors
on Curvature edges are automatically assigned to an Angle T-Rex boundary condition. On the other hand, the connectors on Convex
and Concave edges are automatically assigned to a Max. Aspect Ratio T-Rex boundary condition. After this assignment is completed, the T-Rex
algorithm uses this information to populate the unstructured domains with anisotropic surface cells accordingly. Those edges in the database model that are
not classified as either Curvature, Convex, or Concave edges will not be affected by the T-Rex algorithm. For more information on
connectors classified as Curvature, Convex, and Concave, please see the Advanced tab.
Goals
The tools contained in this frame allow you to adjust the quality goals (i.e. quality constraints) of the new unstructured domains. Additionally, the frame
also contains a pull-down list that enables the selection of the Algorithm used to populate the isotropic portion of the new domains. The selected
option will also define the type of surface cell contained in both the isotropic and anisotropic portions of the new domains.

The Goals frame provides tools to define the quality goals for the new unstructured domains.
The Max. Aspect Ratio parameter limits the maximum aspect ratio allowed for the anisotropic cells created by
the T-Rex algorithm along the 2D T-Rex
boundaries. This parameter has a default value of 10.0. Use the appropriate entry field to specify its numeric value. For more information on how the aspect
ratio of a surface cell is computed, please review the description of the the Aspect Ratio
examine function. Analogously, for more information regarding the involvement of the T-Rex algorithm in the Automatic Surface Mesh functionality,
please review the Resolution section above.
Note: Modifying the Max. Aspect Ratio parameter via the entry field in the Goals frame updates the Aspect
Ratio threshold in the metrics table inside the Display frame.
The Boundary Growth Rate parameter is used to limit the maximum rate of change in the distance between consecutive grid points (i.e. edge length)
along the connectors and compute the decay for unstructured domains created by the Automatic Surface Mesh functionality. Additionally, this parameter
is also used to define the growth rate used by the Sync Spacings and
2D T-Rex algorithms, which are used internally by
the Automatic Surface Mesh functionality. For more information on how these algorithms use the growth rate parameter, please review the linked
sections.
The last element in this frame is a pull-down list with options to select the desired Algorithm for populating the isotropic and anisotropic
(i.e. T-Rex) portions of the unstructured domains being created. The available options in this pull-down list are:
- Advancing Front: If this option is selected, the Advancing Front algorithm will be used to populate the isotropic portion of the
unstructured domains. Additionally, this option sets the surface cell type for both the isotropic and anisotropic portions of the new unstructured domains to
triangles only.
- Quad Dominant: If this option is selected, the Advancing Front Ortho algorithm will be used to populate the isotropic portion of
the unstructured domains. Additionally, this option sets the surface cell type for both the isotropic and anisotropic portions of the new unstructured domains
to quad-dominant (i.e. a combination of triangular and quadrilateral surface cells).
- Hybrid: If this option is selected,the Advancing Front algorithm
will be used to populate the isotropic portion of the unstructured domains. Additionally, this
option sets the surface cell type for the anisotropic portion to quad-dominant (i.e. a
combination of triangular and quadrilateral surface cells) and for the
isotropic portion to triangles only.
Note: For more information about the available isotropic algorithms and the anisotropic T-Rex algorithm, please review
the Algorithm
and T-Rex
sections in the User Manual, respectively.
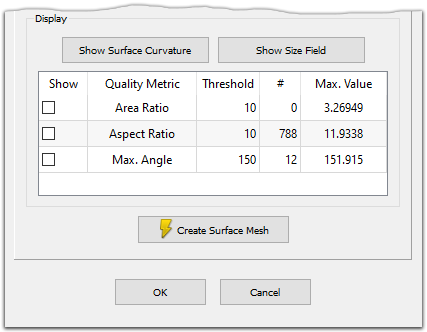
Display
The tools contained in this frame allow you to visualize the size field that drives the
automatic creation of the unstructured domains before the creation process actually starts. Furthermore, the table included in this frame presents information
related to the most relevant quality metrics for the final surface mesh.
The tools in the Display frame enable the visualization of the size field that drives the creation of the unstructured domains. It also presents information
related to the most relevant quality metrics of the final surface mesh.
The first command included in this frame is the Show Size Field command. Click the button to shade the selected database models by the size field in
a grayscale color bar style. Note that the color bar is shown with 10 levels ranging from black (small
edge lengths) to white (large edge lengths). As an added functionality, hover your mouse over the selected database surfaces and note that a sample surface
cell is rendered at the mouse pointer location. The sample cell (a triangle or a quad, depending on the Algorithm selected in
the Goals section above) has an edge length that is consistent with the size field at that particular location.
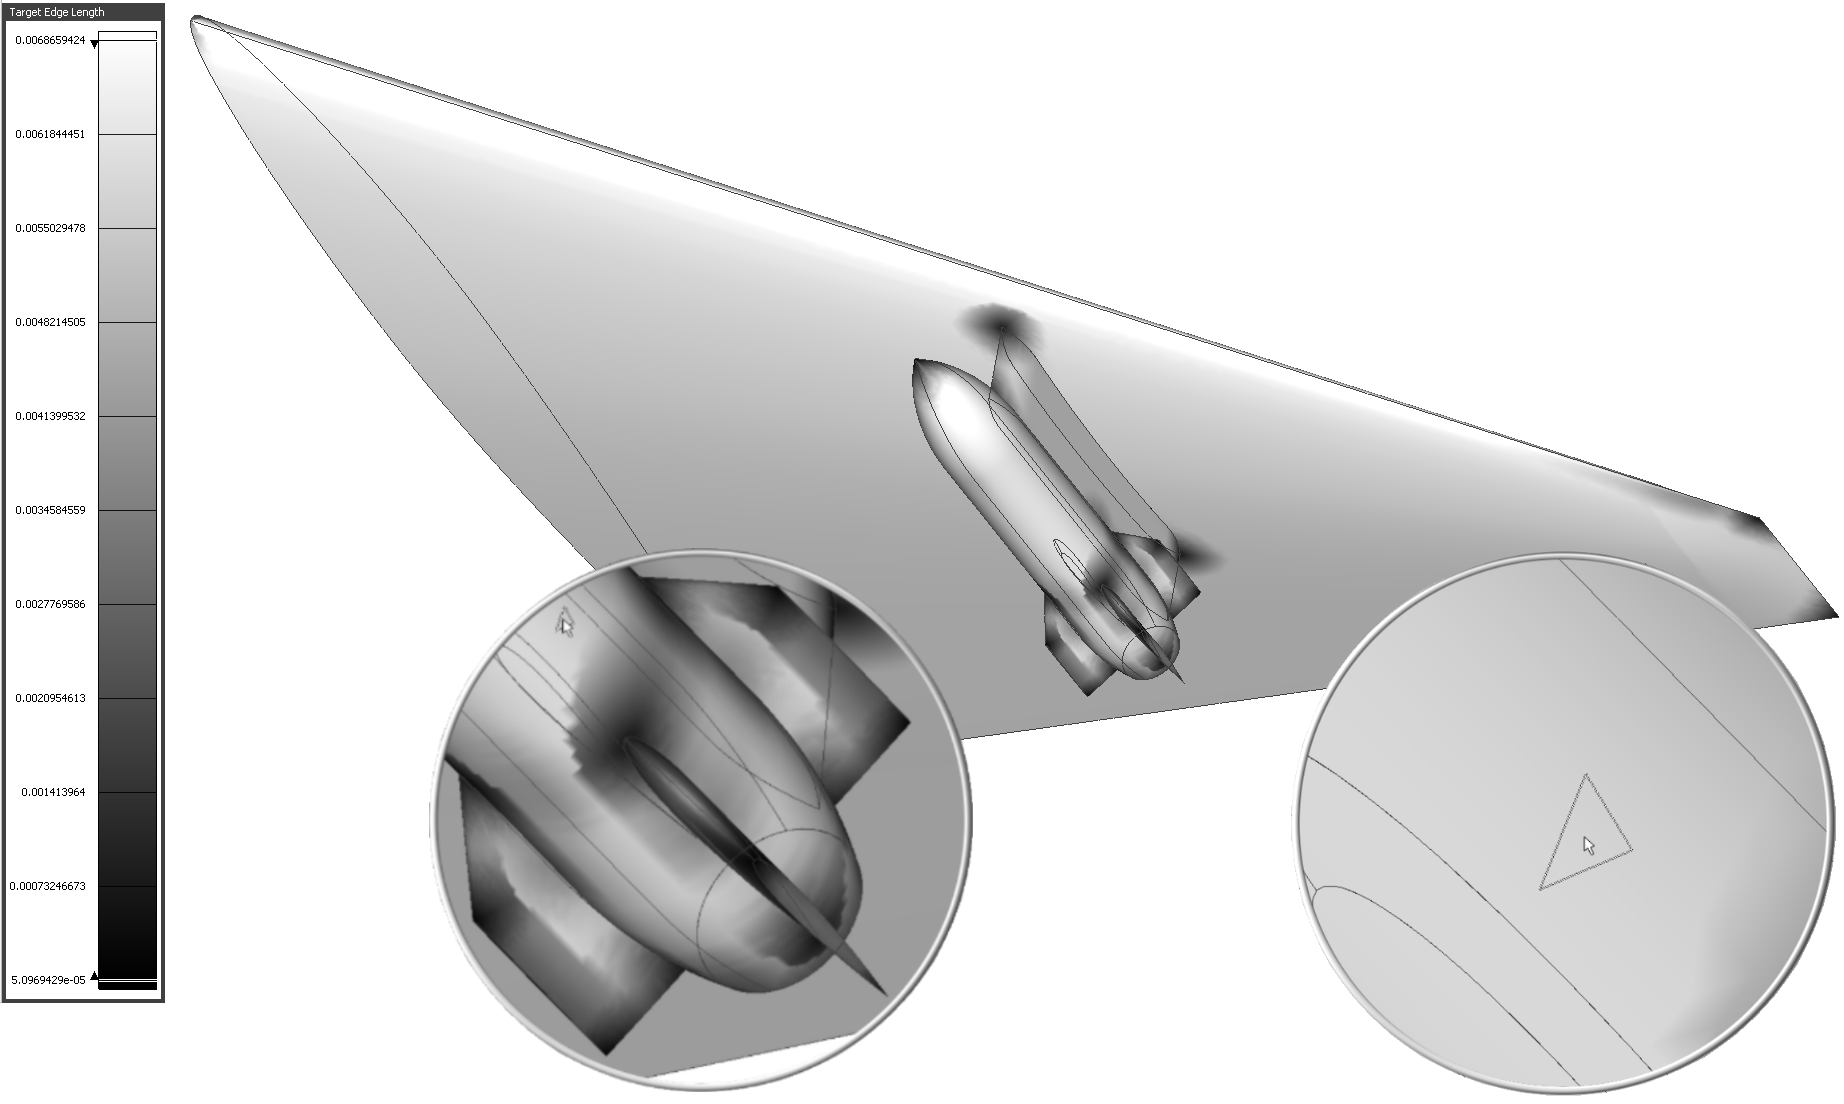
Use the Show Size Field command to render the selected database models shaded by the size field in a grayscale color bar style. Hover your mouse pointer over
the database surface to visualize a cell with the corresponding target edge length (insert image on the right). Note that a triangular of quadrilateral
surface cell is displayed depending on the selected Algorithm.
The second element in this frame is a table displaying information related to different quality metrics for the final set of unstructured domains created by
the Automatic Surface Mesh functionality based on the input parameters. The table consists of five columns displaying the following information:
- Show: This column controls the visualization of the surface cells that violate the defined metric threshold (see the Threshold
column below). When this option is enabled, the cells in violation are rendered in the Display window in red, with
the Flat Fill type, and with its vertices rendered as points in the same color.
- Quality Metric: This column displays the quality metric being examined. Note that the fields in this column are read-only which means that
the quality metrics cannot be changed nor can additional quality metrics be added to the table. This table contains the following quality metrics:
- Area Ratio: This metric has a default Threshold value of 10.0. For detailed information about this metric, review the
description of the Area and Volume Ratio examine function.
- Aspect Ratio: This metric has a default Threshold value of 10.0. For detailed information about this metric, review the
description of the Aspect Ratio examine function.
- Max. Angle: This metric has a default Threshold value of 150.0. For detailed information about this metric, review the
description of the Maximum Included Angle examine function.
- Threshold: This column displays the threshold values for each quality metric. Note that the fields in this column are populated with
default values that can be edited and replaced with user-defined values more suitable for the problem at hand. The threshold values specified in this column
are used to determine which cells are in violation of the different quality metrics.
- #: This column reports the number of surface cells that are in violation of each Quality Metric according to their
respective Threshold values.
- Max. Value: This column reports the maximum value computed for each Quality Metric. Additionally, you can right click your mouse
on each field in this column to reveal a list with three options:
- Zoom to Location: Use this option to zoom to the surface cell with the maximum extrema value of the corresponding Quality
Metric.
- Zoom and Align to Location: Use this option to zoom to the surface cell with the maximum value of the corresponding Quality
Metric and align the view orientation with the normal to the cell in question.
- Set Rotation Point at Location: Use this option to set the Rotation Point at
the centroid of the surface cell with the maximum extrema value for the corresponding Quality Metric.
The last command in the Global panel is the Create Surface Mesh command. When this button is pressed, the automatic mesh generation process
begins. Once the process is finished, the final surface mesh is shown in the Display window and useful information (such as the cell count, point
count, and the maximum metric values and locations) is printed to the Messages window.
Tip: Note that the Create Surface Mesh button contains a lightning bolt ( ). This means that you can use
the Ctrl+F shortcut to quickly perform this operation.
). This means that you can use
the Ctrl+F shortcut to quickly perform this operation.
The Display window also displays a quality Metrics box which shows values for the following metrics: Area Ratio, Aspect
Ratio, Max. Angle, and Max. Edge Length. Furthermore, the values shown correspond to the cell currently under the mouse pointer. Move
your mouse over the surface grid and note how the values update on the fly.
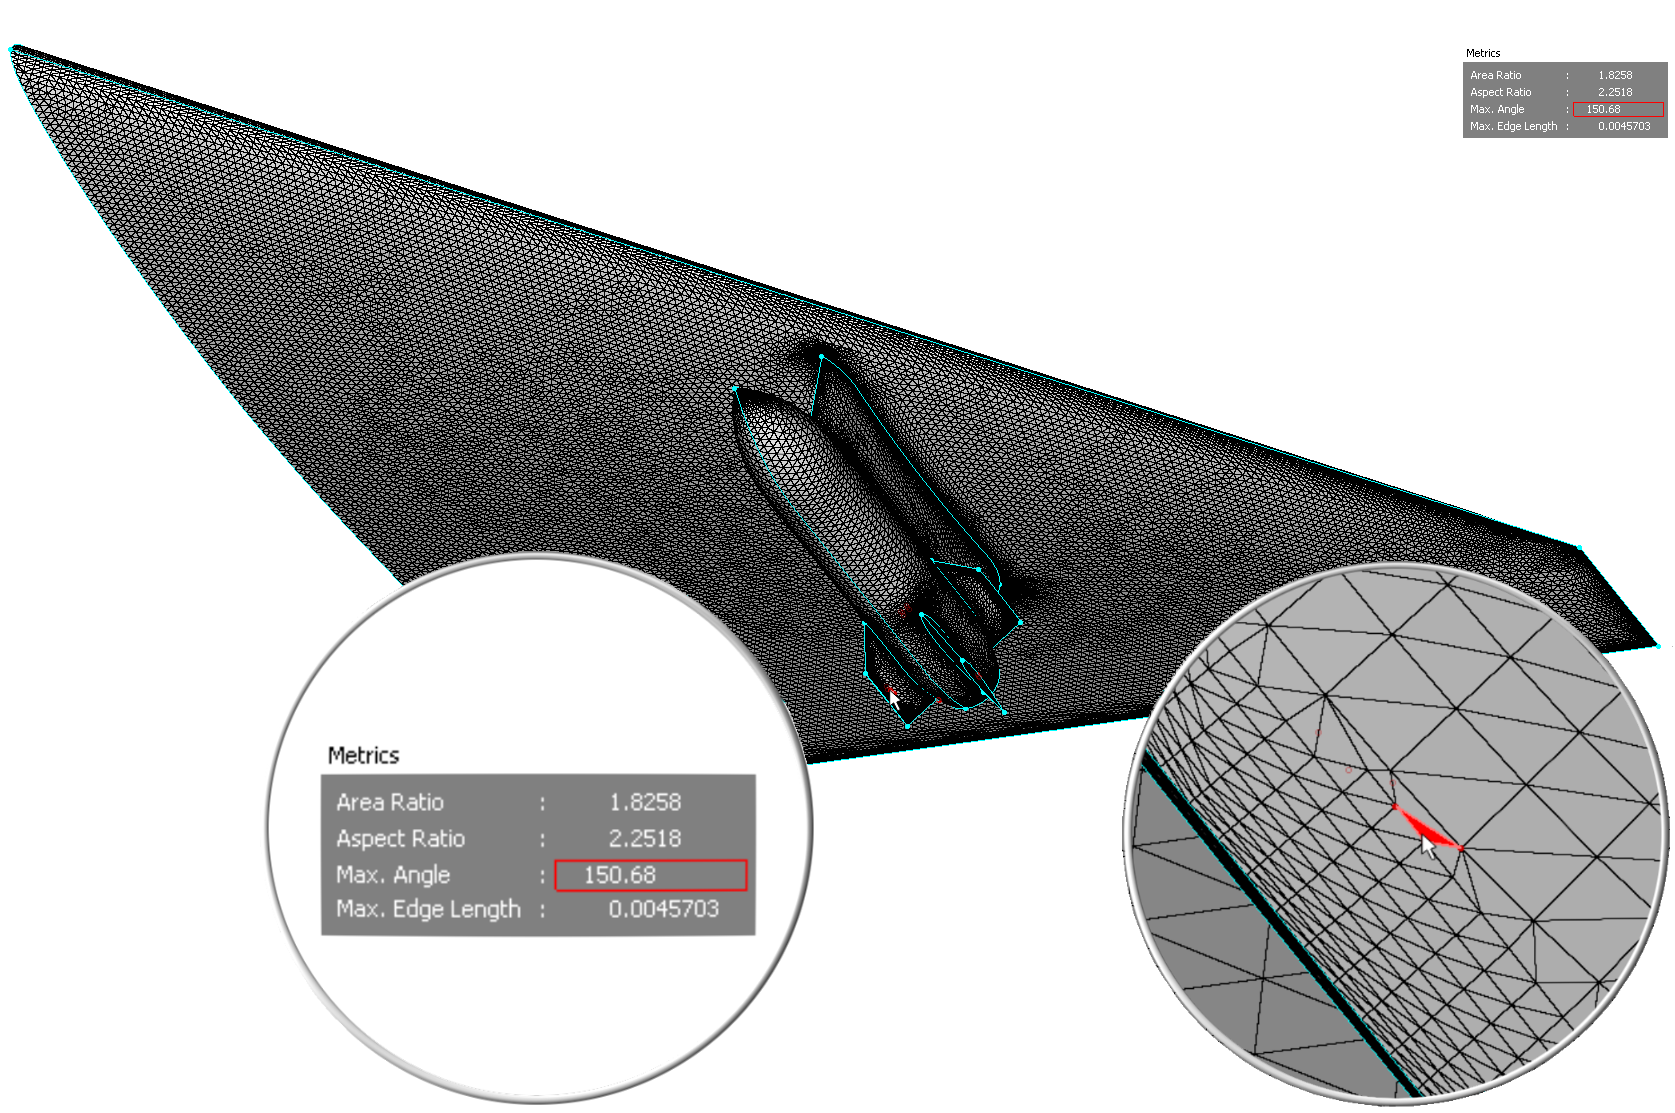
Once a surface mesh has been created, a Metrics box is presented as shown in the top right corner in the main image and the left insert image. Hover
your mouse over the grid to visualize the quality metrics for the surface cell currently under the mouse pointer on the fly. The red surface cells and the
corresponding red frame around a value in the Metrics box denote an extrema value for one of the quality metrics.